civet

Report options
How to customise the civet report
Free text options
Using the config file, there are several points where fully customisable free text can be added. These are:
- title
- outbreak-id
- report-date (default is the day the report is run)
- author list
- description (introduction)
- conclusions
To include multi-line free text, put a “>” character and the start of the free text, and include the new line character (“\n”) where the new lines should go.
Eg:
description: >
  ### Background \n
   This report describes the investigation into an outbreak in the made-up region.
–sequencing-centre
If a custom title is not specified, it will also add the sequencing centre four letter abbreviation into the title.
Current accepted headers are:
BIRM (Birmingham), CAMB (Cambridge), EDIN (Edinburgh), EXET (Exeter), GLAS (Glasgow), GSTT (Guy’s and St Thomas’), LIVE (Liverpool), LOND (London), NIRE (Northern Ireland), NORT (Northumberland), NORW (Norwich), NOTT (Nottingham), OXON (Oxford), PHEC (Public Health England), PHWC (Public Health Wales), PORT (Portsmouth), SANG (Sanger) and SHEF (Sheffield)
The civet creators are open to requests for adding new headers to civet. Please file a github issue and we will address it as soon as we can.

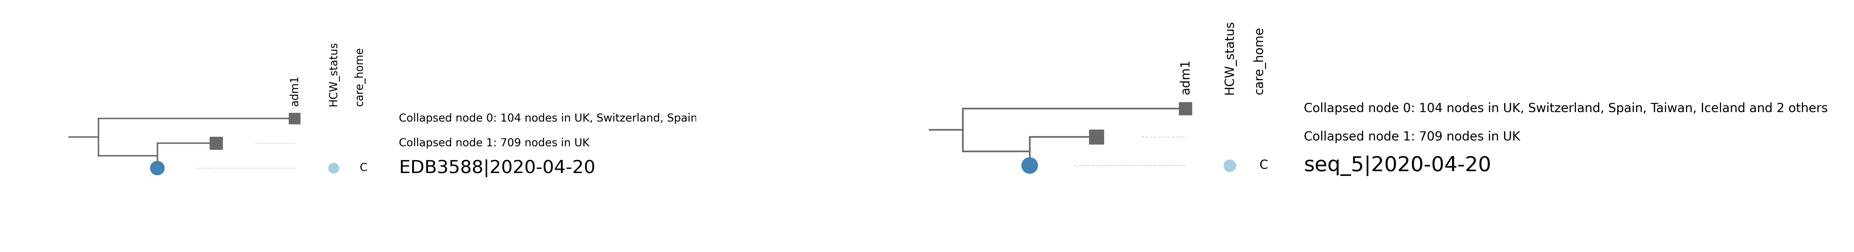
–display-name
Specify a column in the query csv to refer to query sequences by in the report instead of COG IDs. The default is the same as input column. This may be a patient ID for example to make it more quickly and easily interpretable. This name will be used in the phylogeny and the summary table.
### –sample-date-column
Specify column in the query csv that contains the sampling date. Default is “sample_date”.
–tree-fields and –colour-by
A comma separated string containing the column headers of metadata to show on the phylogeny. They will be shown to the right of the corresponding tip, and can be drawn from the query csv or the background metadata csv.
The default is to place the text found in the appropriate entry in the metadata into the tree. However, by using –colour-by the data can be shown as coloured circles instead. A colour scheme can also be provided, as long as it is matplotlib compatible (see https://matplotlib.org/3.1.1/gallery/color/colormap_reference.html for a list of approved colour maps). The default is “Paired”.
To use colour-by, provide a comma separated string of fields. To add the colour scheme, use a “:” or a “=”. For example:
adm1=viridis, adm2=plasma,care_home
will colour adm1 and adm2 with the specified colour schemes, and care_home by the default colour scheme.
Any tree fields will be shown in between the tip and the label, going from left to right.
If no colour-by option is provided, the tips will be coloured by adm1 ie England, Scotland, Wales or Northern Ireland.
NB Fields in colour-by must also be present in the tree-fields list.
–label-fields and –safety-level
–safety-level
An integer value (0, 1 or 2) that configures the level of anonymisation needed in the report. Default: 1
0) Anonymisation off. COG-IDs and adm2 metadata shown for all sequences if adm2 present in either query or background metadata
1) No COG-IDs shown for anything but query sequences specified with the -i / --input flag (i.e. not with the --from-metadata option). If run on CLIMB, adm2 present in the report.
2) COG-IDs shown on query sequenecs and background sequences, but none show adm2 (equivalent to the ‘publically available’ data)
The query sequences, if they are specified as a list of sequences or in a csv, will always show either their name or the specified --display-name regardless of safety level.
–label-fields A comma separated string of metadata headers containing information to be displayed in the labels in the phylogeny.
By default, the input_column and sample_date (if provided) will be used. Depending on the –safety-level and if adm2 is present in either metadata (for example if you ran on CLIMB) this will also be shown.
If any fields are provided using the label fields option, these will be overwritten, and the display name and specified fields will be shown.
For example, a query sequence has the following metadata:
| display name | adm1 | adm2 | date | care home |
|---|---|---|---|---|
| EDB1234 | Scotland | Edinburgh | 2020-09-23 | A |
Under safety level 0 and safety level 1, the default label would be: “EDB1234|Edinburgh|2020-09-23”
Under safety level 2, the default label would be: “EDB1234|2020-09-23”
and using
--label-fields adm1,care_home
regardless of safety level will show:
“EDB1234|Scotland|A”
Therefore once you specify any label fields, you must specify all those that you want other than the display name.
Note: the label-fields overwrites the safety level for all query data. If you specify adm2, regardless of safety level, the query sequences will show adm2 in their labels. However, the appropriate anonymisation of the COG IDs will still take place if safety level is 1 and the queries were found using --from-metadata, and background sequence labels are assigned by safety level.
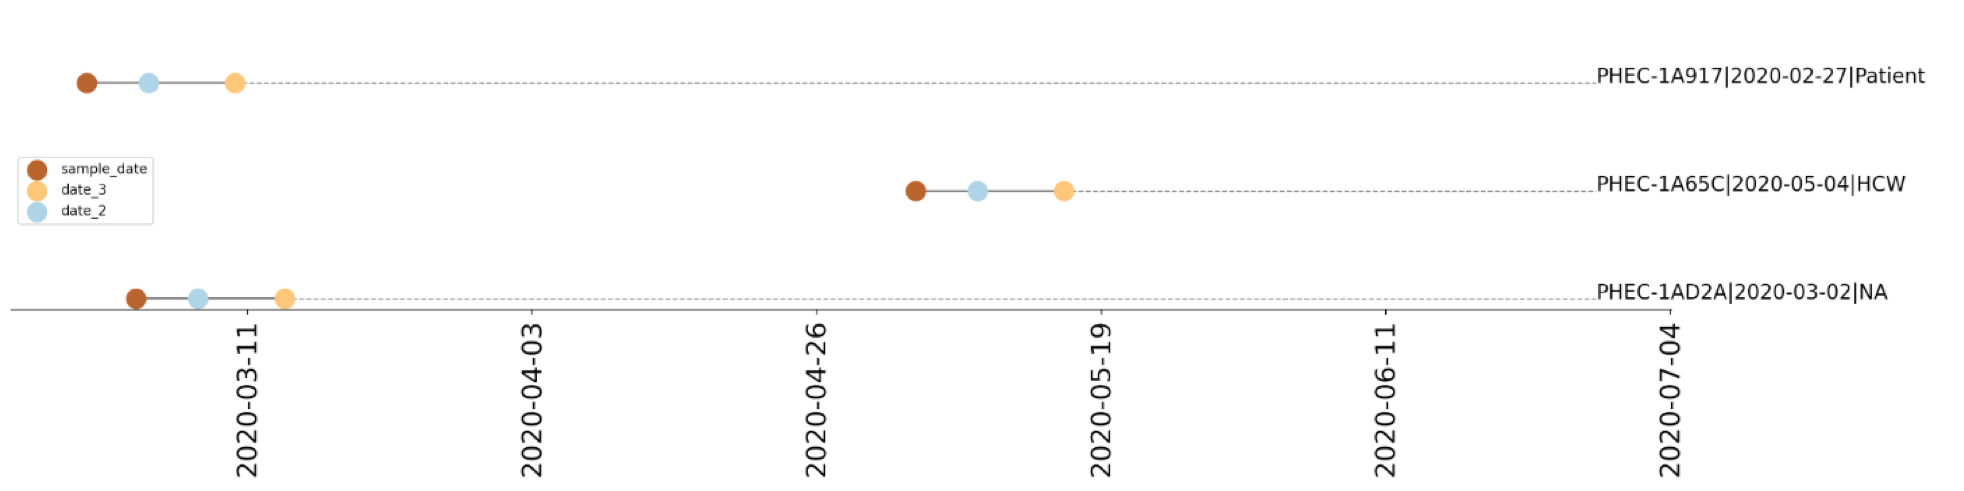
–date-fields
Provide column headers from the query metadata or the background metadata as a comma separated string that contain date information to plot those dates on a timeline.
NB all date formats must be in YYYY-MM-DD format.
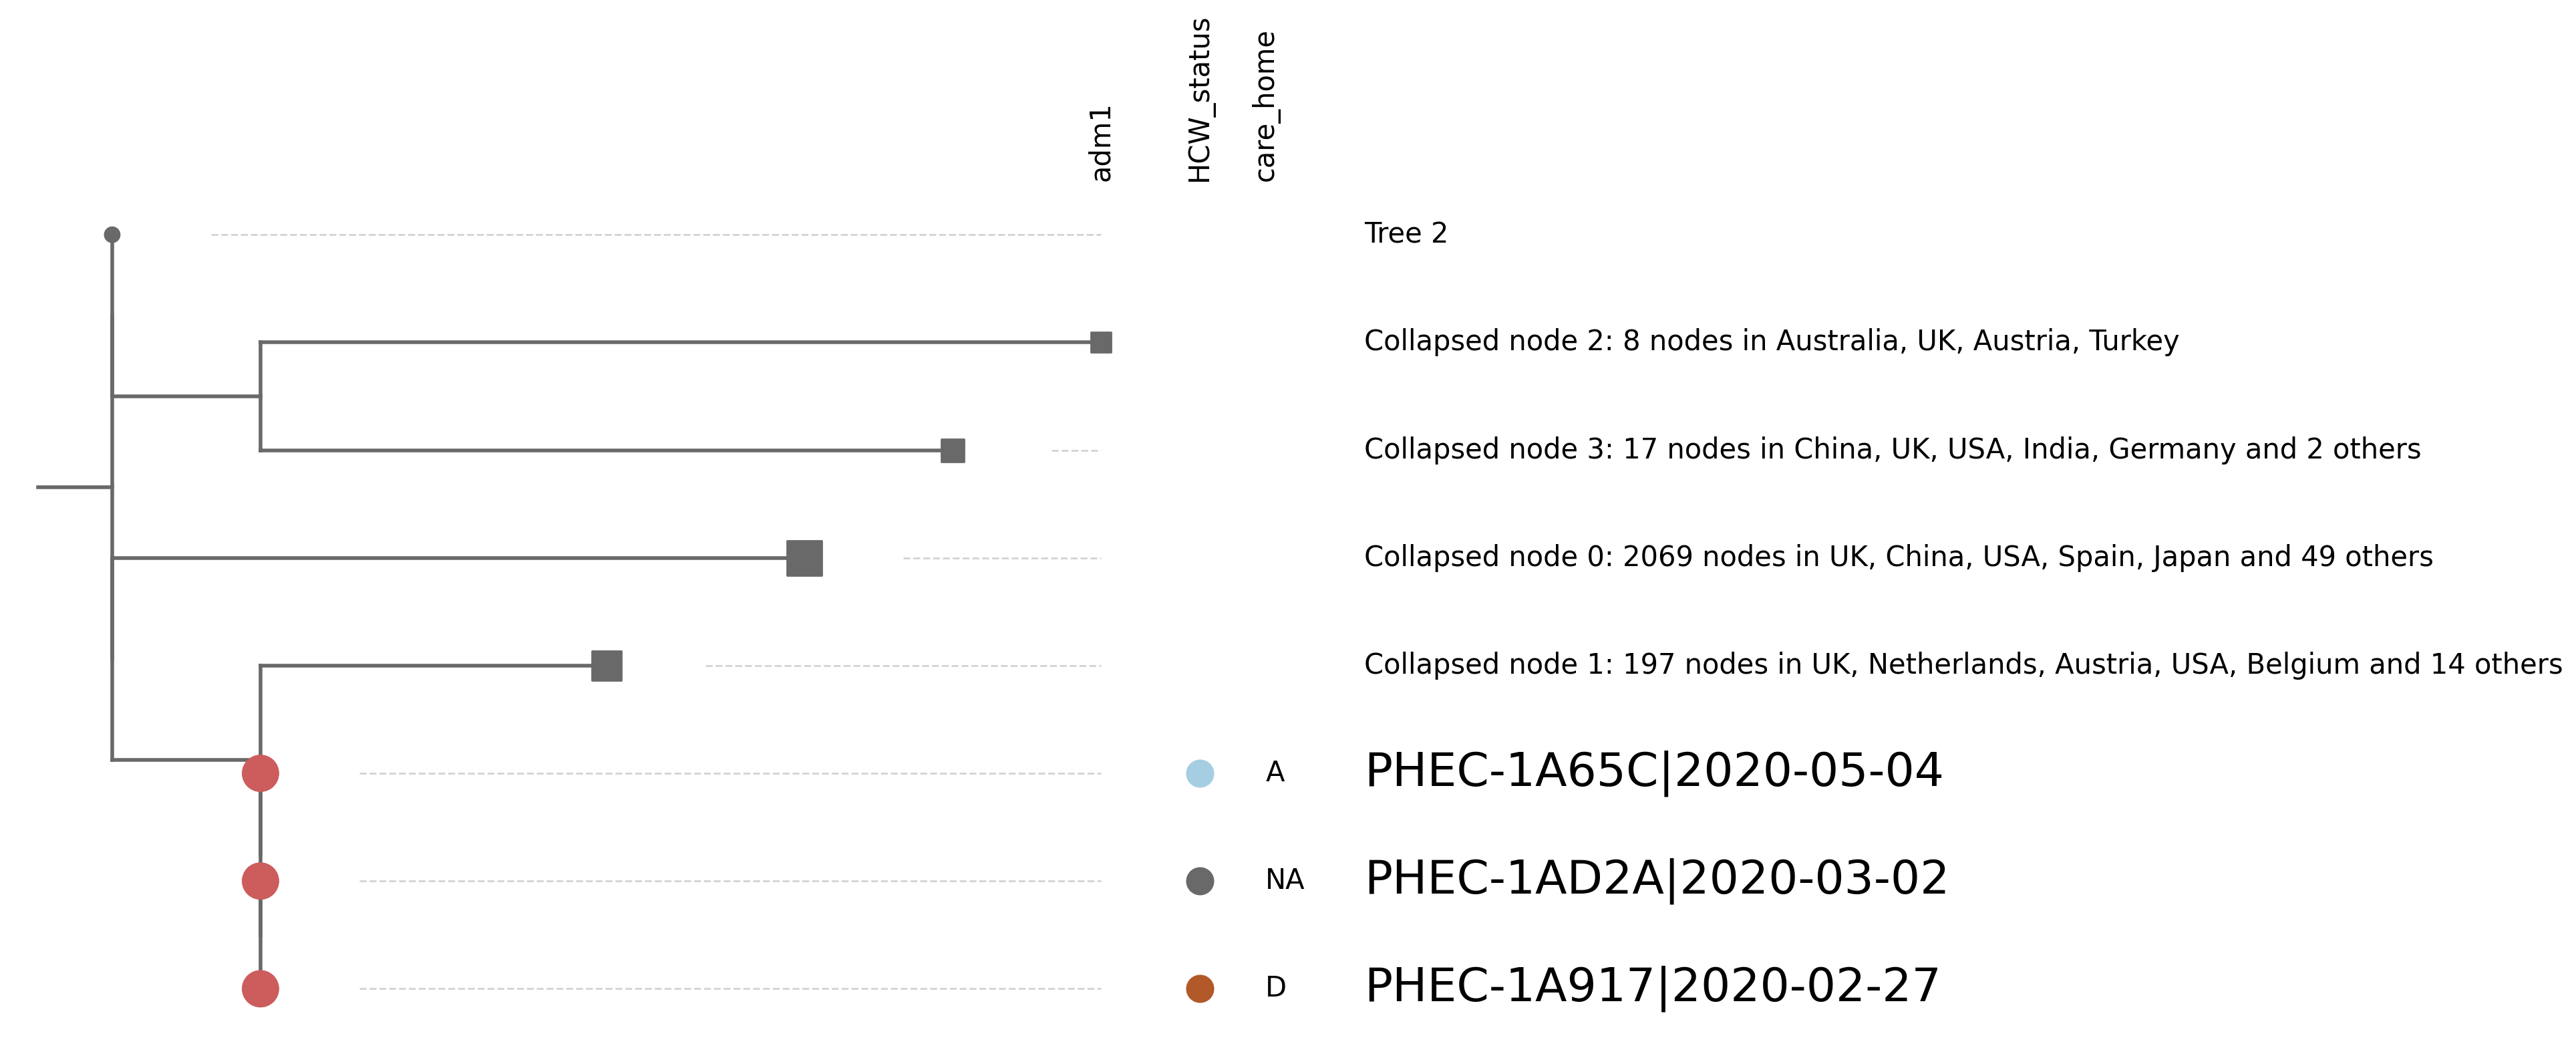
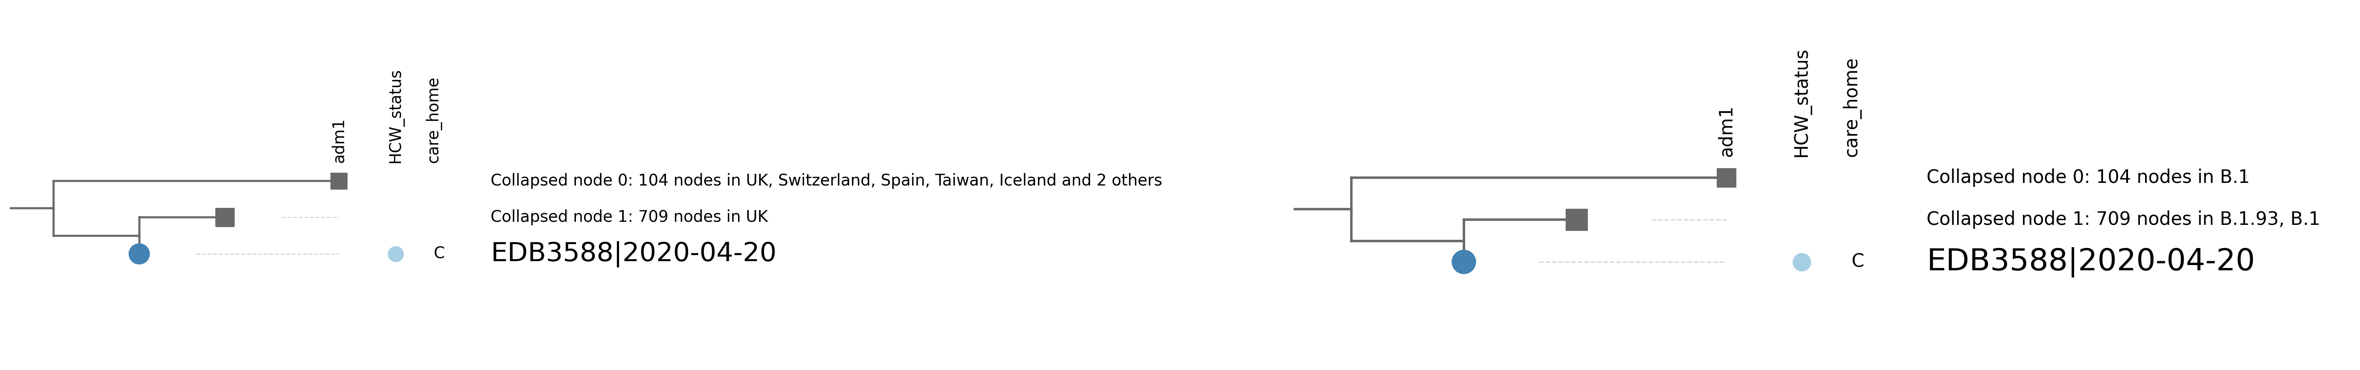
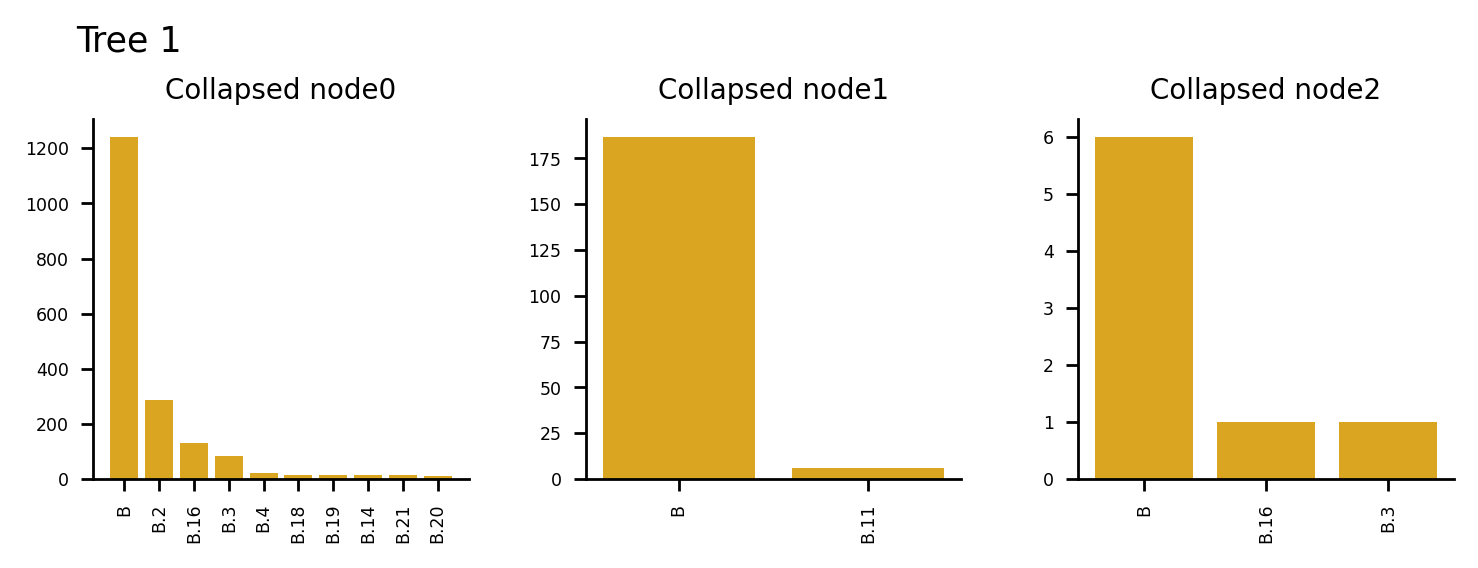
–node-summary and –include-bars
Provide a header in the background metadata table to summarise collapsed nodes by in the phylogeny. Default is country.
If –include-bars is called, this information will also be displayed as bar charts.
–table-fields and –remove-snp-table
The table shown in the report will always include:
- Query ID
- Name of the query in the tree if the sequence is in the background metadata OR the name of the closest sequence in the tree if the query has not been found in the background metadata
- The local tree ID in the report for each query
By using –table-fields a comma separated string of metadata column headers may be provided to add other elements to the table. The default is sample_date, uk_lineage, lineage, phylotype. For sequences not found in the COG database, the lineage and phylotype designations will be in reference to the closest sequence to the query in the database.
In addition, unless –remove-snp-table is called, for those sequences not found in the metadata the following will be displayed in the second table.:
- SNP distance to closest sequence in the metadata
- What those SNPs are
–no-snipit
By using this flag, the Snipit table (table showing location of SNPs in the alignment) is removed from the report.
–omit-appendix
Removes appendix from the report.